
Server Monitoring Dashboard
Project Specs
- Category: Projects
- Published: July 22, 2026
Server Monitoring Dashboard Implementation Using Komari
Project Overview
The Server Monitoring Dashboard using Komari is a centralized infrastructure monitoring solution implemented to provide real-time visibility into the health, performance, and availability of servers and services across multiple environments. The project was designed to simplify infrastructure management by consolidating monitoring information into a single dashboard, allowing system administrators and DevOps engineers to proactively identify issues before they impact business operations.
As organizations increasingly rely on digital services, maintaining server uptime and infrastructure reliability has become essential. Managing multiple Linux servers, Docker containers, web services, databases, VPN servers, and applications manually is both time-consuming and prone to human error. To address these challenges, I implemented Komari, a lightweight self-hosted monitoring dashboard that provides centralized status reporting and infrastructure visibility.
As the Senior DevOps Engineer and System Administrator, I was responsible for the complete implementation of the monitoring platform, including infrastructure planning, server deployment, Docker-based installation, service integration, dashboard customization, security hardening, backup configuration, and ongoing maintenance. The monitoring system was designed to provide a real-time overview of infrastructure health while simplifying operational monitoring for technical teams.
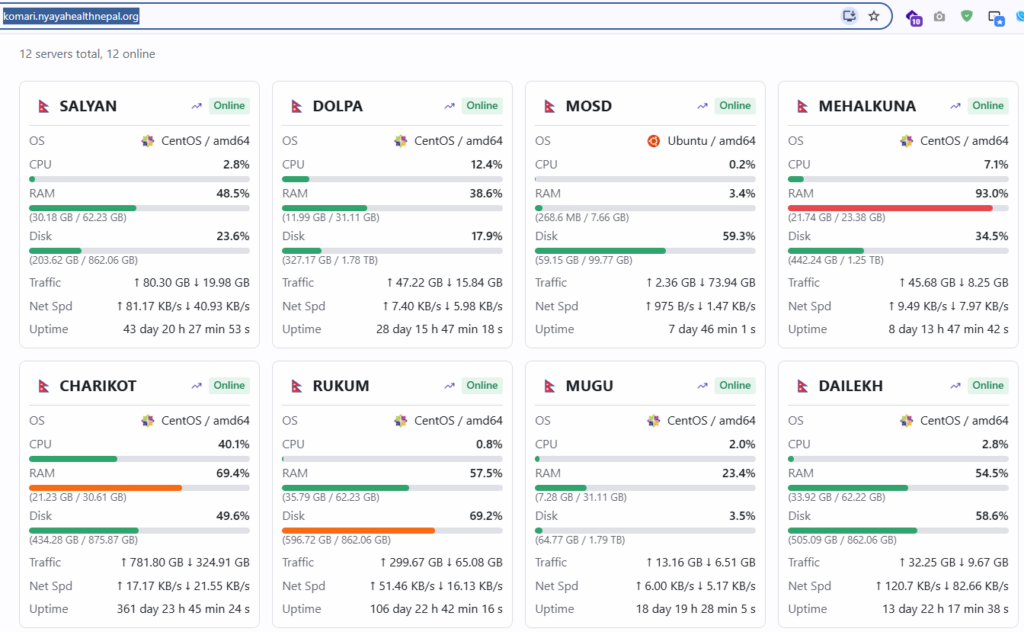
The dashboard monitors multiple production and development environments, enabling administrators to quickly identify server outages, high resource utilization, application failures, and network connectivity issues. Instead of checking individual servers manually, administrators can monitor the entire infrastructure from a single interface, improving operational efficiency and reducing incident response time.
The project demonstrates my expertise in infrastructure monitoring, Linux server administration, Docker, DevOps, automation, and enterprise infrastructure management.
Project Background
Modern IT environments often consist of numerous interconnected services running across multiple physical servers, virtual machines, cloud instances, and Docker containers. Without centralized monitoring, identifying infrastructure problems can be difficult, resulting in delayed responses and increased downtime.
Prior to implementing the monitoring solution, infrastructure health was primarily checked manually using individual server logins and command-line utilities. This approach required considerable administrative effort and made it challenging to obtain a real-time overview of system health across multiple environments.
The objective of the project was to develop a centralized monitoring dashboard capable of displaying server status, application availability, and infrastructure health from a single location while remaining lightweight, secure, and easy to maintain.
Project Objectives
The primary objectives included:
- Centralize infrastructure monitoring.
- Monitor production and development servers.
- Display real-time server status.
- Improve infrastructure visibility.
- Reduce incident response time.
- Simplify infrastructure management.
- Monitor Docker-based services.
- Support proactive system maintenance.
- Build a lightweight self-hosted monitoring solution.
- Improve operational reliability.
My Role
As the project lead, I managed the complete implementation and ongoing maintenance of the monitoring platform.
My responsibilities included:
- Infrastructure planning.
- Linux server administration.
- Docker deployment.
- Komari installation and configuration.
- Reverse proxy configuration.
- SSL certificate implementation.
- Dashboard customization.
- Service registration.
- Authentication configuration.
- Backup automation.
- Security hardening.
- Performance optimization.
- Monitoring integration.
- Documentation.
- Technical support.
- Continuous maintenance.
Technologies Used
Monitoring Platform
- Komari
Infrastructure
- Linux (Ubuntu)
- Docker
- Docker Compose
- Nginx
- Apache
DevOps
- Git
- Shell Scripting
- Docker Registry
- CI/CD Support
Monitoring Targets
- Linux Servers
- Docker Containers
- Web Applications
- Database Servers
- VPN Servers
- API Services
- Reverse Proxies
Security
- SSL/TLS
- Firewall Configuration
- Authentication
- Automated Backup
Key Features
The monitoring dashboard includes numerous operational features that improve infrastructure management.
Major features include:
- Real-Time Server Status
- Service Availability Monitoring
- Docker Container Monitoring
- Web Application Status
- Database Service Monitoring
- Network Service Monitoring
- Reverse Proxy Status
- SSL Certificate Monitoring
- Centralized Dashboard
- Server Group Organization
- Environment Classification
- Quick Status Overview
- Public or Private Dashboard Support
- Mobile Responsive Interface
- Lightweight Architecture
- Easy Service Registration
- Secure Authentication
- Self-Hosted Deployment
System Architecture
The monitoring platform follows a centralized architecture where individual infrastructure components are registered within Komari. Production servers, staging environments, databases, APIs, VPN gateways, and web applications are organized into logical groups for simplified management.
The dashboard provides administrators with a single interface displaying the operational status of all monitored systems. Services can be categorized by environment, project, or function, making it easier to identify affected systems during maintenance or outages.
Docker-based deployment simplifies upgrades and maintenance while allowing the platform to be easily migrated or expanded as infrastructure grows.
Performance Optimization
The monitoring platform was designed to remain lightweight while monitoring multiple servers and services simultaneously. Docker containers minimize resource consumption and simplify deployment across different environments.
Server resources were optimized through efficient container configuration, lightweight monitoring processes, and streamlined dashboard rendering. Reverse proxy optimization, caching strategies, and secure HTTPS communication further improved responsiveness.
Routine maintenance and software updates ensure long-term reliability while minimizing operational overhead.
Security Implementation
Security was an important consideration throughout the implementation process.
HTTPS encryption protects communications between users and the monitoring platform. Administrative access is restricted using authentication mechanisms and role-based permissions where appropriate. Firewall rules restrict unauthorized access to monitoring services, while regular backups protect dashboard configuration and monitoring data.
Docker isolation, secure server configuration, SSL certificate management, and routine security updates further enhance platform security.
Challenges
One of the primary challenges involved organizing a diverse infrastructure consisting of multiple production servers, Docker containers, databases, web applications, and supporting services into a single monitoring dashboard without compromising usability.
Another challenge was maintaining a lightweight solution that could be deployed quickly without introducing unnecessary infrastructure complexity. Careful service organization, optimized Docker deployment, and standardized monitoring configurations helped achieve a scalable and easy-to-maintain implementation.
Ensuring secure remote access while maintaining operational simplicity was another important consideration. HTTPS encryption, authentication, and secure network configuration were implemented to protect monitoring information while allowing authorized administrators to access the dashboard from different locations.
Results and Impact
The implementation of the Komari Server Monitoring Dashboard significantly improved infrastructure visibility and operational efficiency. Administrators can now monitor multiple servers and services from a centralized interface, reducing the need for manual server inspections and enabling faster identification of operational issues.
The dashboard has improved proactive infrastructure management by providing immediate visibility into server availability, application status, and service health. Routine maintenance has become more efficient, while incident response times have been reduced through centralized monitoring and improved situational awareness.
The project also strengthened my expertise in DevOps, Linux server administration, Docker-based deployments, infrastructure monitoring, and enterprise operations management. It demonstrates my ability to design and implement practical, scalable solutions that improve system reliability and simplify day-to-day infrastructure management.
Conclusion
The Server Monitoring Dashboard using Komari represents an important infrastructure management project within my professional portfolio. By implementing a centralized, self-hosted monitoring solution, I created a reliable platform that enhances operational visibility, improves system administration, and supports proactive maintenance across multiple environments.
This project showcases my expertise in DevOps, infrastructure monitoring, Linux administration, Docker containerization, and secure system deployment. It reflects my commitment to building efficient, scalable, and maintainable operational tools that improve infrastructure reliability and enable organizations to manage their IT environments with greater confidence and efficiency.